

Prometheus教程(5)常用exporter的安装与使用配置
一、exporter介绍
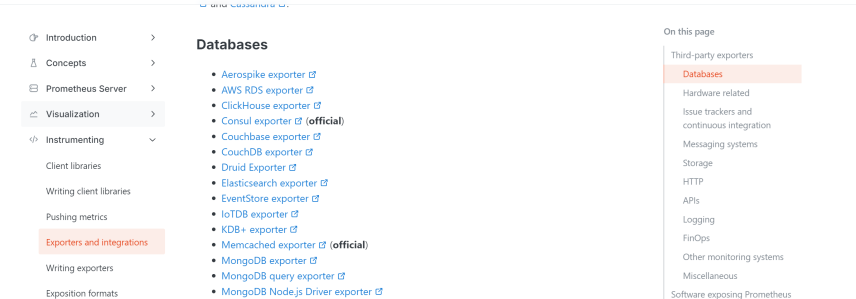
Prometheus exporter的作用是通过HTTP协议开放符合规范的指标数据给Prometheus抓取。在Prometheus官网提供了大量现成的exporter,基本覆盖了全部的主流组件,比如用于监控操作系统的node_exporter、用于监控MySQL的mysql_exporter、用于监控域名过期时间的domain_exporter、黑盒监控black_box等。按需部署对应的exporter即可完成相关监控,这些exporter的下载地址为https://prometheus.io/docs/instrumenting/exporters

二、node_exporter
1、下载exporter
wget https://github.com/prometheus/node_exporter/releases/download/v1.8.2/node_exporter-1.8.2.linux-amd64.tar.gz
2、启动node_exporter
直接运行程序即可启动node_exporter并且自动进行数据采集,node_exporter默认会对一些常见的指标进行采集,比如 CPU、内存、网络。对于一些非常见或者可能占用资源较高的指标并没有默认打开,如果有需要监控的话可以通过特定的参数来启用这些收集器,通过help可以查看哪些选项会被默认开启或者关闭。
· --collector.<指标名>:启用指定的监视器
· --no-collector.<指标名>:禁用默认激活的收集器
# bin/node_exporter --collector-diskstats  #打开磁盘状态相关监控
# bin/node_exporter --collector.systemd --collector.systemd.unit-whitelist=(docker|sshd|nginx).service


/usr/local/node_exporter/node_exporter \
  --web.listen-address=:9100 \
  --collector.cpu \
  --collector.meminfo \
  --collector.vmstat \
  --collector.diskstats \
  --collector.filesystem \
  --collector.netdev \
  --collector.tcpstat
3、查看node_exporter
node_exporter启动完成后默认监听在9100端口,访问该端口可以看到指标数据以metrics的格式暴露出来,这样Prometheus就可以获取并监控
curl ip:9100/metrics
# TYPE node_cpu counter  #TYPE说明了数据类型为counter
node_cpu{cpu="cpu0",mode="idle"} 362812.78906254、node_exporter服务注册
cat /etc/systemd/system/node_exporter.service
[Unit]
Description=node_exporter
Documentation=https://prometheus.io
After=network.target
[Service]
ExecStart=/usr/local/node_exporter/node_exporter --web.listen-address=:9100 --collector.filesystem --collector.netdev --collector.cpu --collector.meminfo --collector.vmstat --collector.diskstats  --collector.tcpstat
ExecStop=/bin/kill -HUP $MAINPID
TimeoutStopSec=20s
Restart=always
[Install]
WantedBy=multi-user.target
5、后台启动node_exporter
systemctl daemon-reload
systemctl enable node_exporter
systemctl start node_exporter
6、Prometheus对接node_exporter,编辑Prometheus配置文件,手动增加node信息
global:
  scrape_interval: 15s
scrape_configs:
  - job_name: "prometheus"
    metrics_path: "/metrics"
    static_configs:
    - targets: ["192.168.159.101:9090"]

  - job_name: "node"
    metrics_path: "/metrics"
    static_configs:
    - targets: ["192.168.159.101:9100"]
7、热加载Prometheus
curl -X POST http://192.168.159.101:9090/-/reload
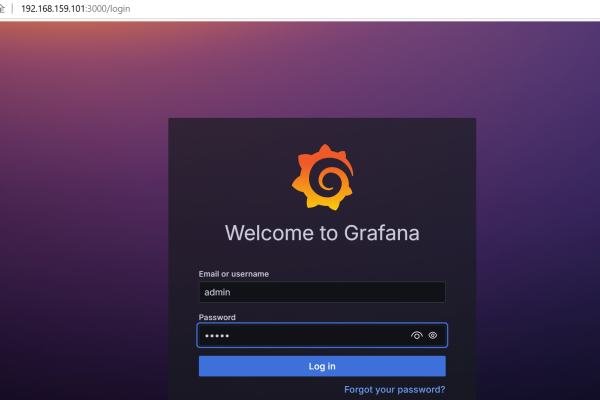
8、进入Prometheus Web端,正常情况下可以看到之前定义好的job,配合Grafana可以进行图形化监控

三、redis_exporter
Redis自身的info命令虽然已经提供了大量的指标,但是这些数据并不能直接暴露给Prometheus,所以也需要依赖exporter来将这些数据提供给Prometheus
1、下载redis exporter
wget https://github.com/oliver006/redis_exporter/releases/download/v1.67.0/redis_exporter-v1.67.0.linux-amd64.tar.gz
tar zxf redis_exporter-v1.67.0.linux-amd64.tar.gz
2、注册redis exporter为系统服务
vi /etc/systemd/system/redis_exporter.service
[Unit]
Description=Redis Exporter
After=network.target
[Service]
Type=simple
ExecStart=/usr/local/bin/redis_exporter --redis.addr=redis://192.168.159.102:6379 --redis.password=123456789
ExecStop=/bin/kill -SIGTERM $MAINPID
Restart=no
[Install]
WantedBy=multi-user.target
3、启动服务
systemctl daemon-reload
systemctl start redis_exporter
4、将redis exporter注册到consul(如果没有使用consul可跳过)
curl -X PUT "http://192.168.159.101:8500/v1/agent/service/register" \
-H "Content-Type: application/json" \
-d '{
  "Name": "redis-exporter",
  "Tags": ["redis"],    #这里定义了一个标签到consul的meta_consul_tags中,后续Prometheus会获取到标签用于分组
  "Address": "192.168.159.102",
  "Port": 9121,
  "Check": {
    "Name": "Redis Exporter Health Check",
    "HTTP": "http://192.168.159.102:9121/metrics",
    "Method": "GET",
    "Interval": "15s",
    "Timeout": "5s"
  }
}'
5、修改Prometheus配置文件并重启服务
vi /data/prometheus/conf/prometheus.yml
global:
  scrape_interval: 15s
scrape_configs:
  - job_name: "prometheus"
    metrics_path: "/metrics"
    static_configs:
    - targets: ["192.168.159.101:9090"]

  - job_name: "node_by_consul"
    consul_sd_configs:
    - server: "192.168.159.101:8500"

  - job_name: "redis"
    consul_sd_configs:
    - server: "192.168.159.101:8500"
    relabel_configs:
      - source_labels: [__meta_consul_tags]
        regex: .*redis.*
        action: keep


curl -X POST http://192.168.159.101:9090/-/reload
6、查看数据,已经成功监控

四、mysql_exporter
通过mysqld exporter进行MySQL监控时需要确保每个 MySQL 实例对应一个mysqld exporter,并且为 MySQL 实例分配专门的监控账号来连接数据库获取数据
1、创建监控账户并授权
create user 'prometheus'@'%' identified by '123456789';
GRANT PROCESS,REPLICATION CLIENT,SELECT ON *.* TO 'prometheus'@'%';
2、访问https://github.com/prometheus/mysqld_exporter进行下载
wget https://github.com/prometheus/mysqld_exporter/releases/download/v0.16.0/mysqld_exporter-0.16.0.linux-amd64.tar.gz
3、因为MySQL密码不能直接传递给exporter,需要通过变量传递,所以先手动启动下mysqld exporter进行测试
export MYSQLD_EXPORTER_PASSWORD=123456789
mysgld_exporter --mysgld.address=localhost:3306 --mysgld.username=prometheus
4、注册mysqld exporter为系统服务
vi /etc/systemd/system/mysqld_exporter.service

[Unit]
Description=MySQL Exporter
After=network.target

[Service]
Type=simple
Environment="DATA_SOURCE_NAME=prometheus:123456789@(127.0.0.1:3306)/"
ExecStart=/usr/local/bin/mysqld_exporter
Restart=on-failure

[Install]
WantedBy=multi-user.target
5、启动mysqld exporter
systemctl daemon-reload
systemctl start mysqld_exporter
systemctl enable mysqld_exporter
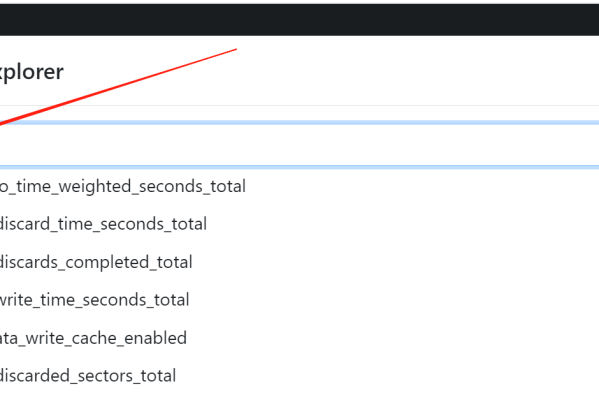
6、查看数据
五、blackbox_exporter
blackbox_exporter用于从外部对某个服务进行黑盒探测,通过模拟用户的行为来观察服务是否可达、响应状态码是否正确、域名解析是否正常等。该exporter暴露的接口地址为/probe而不是/metrics,而且还需要对目标地址和参数进行relabel操作
1、下载blackbox exporter
wget https://github.com/prometheus/blackbox_exporter/releases/download/v0.27.0/blackbox_exporter-0.27.0.linux-amd64.tar.gz
2、解压blackbox exporter安装包后可以看到一个配置文件blackbox.yml,该配置文件用于定义所需要使用的监控模块。如2XX\5XX状态码检测模块、TCP响应、ICMP响应模块等
vi blackbox.yml
modules:
  http_2xx:
    prober: http
    http:
      preferred_ip_protocol: "ip4"
  http_post_2xx:
    prober: http
    http:
      method: POST
  tcp_connect:
    prober: tcp
  pop3s_banner:
    prober: tcp
    tcp:
      query_response:
      - expect: "^+OK"
      tls: true
      tls_config:
        insecure_skip_verify: false
3、启动blackbox exporter,默认监听9115端口
blackbox exporter --config.file=/etc/blackbox_exporter/blackbox.yml
4、进行Prometheus relabel配置,把需要被监控的目标信息作为参数传给blackbox,否则Prometheus会错误的把target地址作为probe接口的地址,而实际上这些target上根本没有这些接口
#配置relabel前会出现抓取地址错误的问题
http://www.ywpie.com/probe?module=http_2xx

#配置后抓取的URL地址
http://127.0.0.1:9115/probe?target=www.ywpie.com&module=http_2xx
配置文件内容如下
scrape_configs:
  - job_name: 'http_2xx'
    metrics_path: /probe    #blackbox的默认接口地址
    params:
      module: [http_2xx]   #使用Blackbox的http_2xx模块
    static_configs:
      - targets:              #需要被监控的对象
        - https://www.ywpie.com
    relabel_configs:
      - source_labels: [__address__]  #这里__address__的值默认为上面targets中的每条信息
       target_label: __param_target   #将每个__address__的值(每个域名)转为__param_target,这是blackbox所需要的target参数
      - source_labels: [__param_target] #将__param_target的值(依然为每个域名)重新传给instance标签
        target_label: instance
      - target_label: __address__       #Prometheus实际抓取地址是blackbox_exporter,而不是https://www.ywpie.com
       replacement: 127.0.0.1:9115   #blackbox_exporter地址
5、重启Prometheus
curl -X POST http://192.168.159.101:9090/-/reload
6、查看数据,如果指标异常的话通常值为0,然后再针对其进行报警


猜你喜欢

运维技术 Prometheus教程(7)使用PushGateway自定义监控
一、PushGateway 介绍在 Prometheus 的体系结构中,需要依赖 PushGateway 来对一些生命周期较短的任务或者无法被 Prometheus 直接拉取到指标的对象进行...
运维技术 Prometheus教程(6)AlertManager告警部署与配置
一、 Alertmanager 介绍AlertManager 是 Prometheus 生态中实现告警管理的关键组件。Prometheus会定期检查指标数据是否与设定好的告警规则匹...
运维技术 Prometheus教程(4)指标类型与常用函数
一、Prometheus 指标类型介绍Prometheus 提供了四种指标类型,这些类型定义了指标值的语义和处理方式,不同的指标类型也有不同的聚合函数搭配使用1、Gauges仪表盘型,该指标类型的值会...
运维技术 Prometheus教程(3)PromQL用法详解
一、PromQL 基本介绍PromQL 全称 Prometheus Query Language,它是 Prometheus 专用查询语言。通过PromQL可以灵活的对每个指标实现条件查询、...
运维技术 Prometheus教程(2)安装部署Grafana并对接Prometheus

一、Grafana介绍Grafana是一款开源的可视化平台,它能够将来自不同数据源的数据(可以集成 Prometheus、Elasticsearch、MySQL 等多种数据源)转换成丰富的图形、图表(...
文章评论